Product Metrics are measurable numbers that tell you:
How Users Behave
         ↓
How Product Performs
         ↓
Whether Business Is Growing
Simply put:
Product metrics help you understand if your product is creating value for customers and the business.
Imagine driving a car.
You don't drive using guesses.
You monitor:
Fuel Level
Speed
Engine Temperature
Distance Travelled
Similarly, product teams monitor:
Users
Retention
Revenue
Engagement
Growth
Without metrics:
Build Features
      ↓
Hope For Success
With metrics:
Measure
   ↓
Learn
   ↓
Improve
   ↓
Grow
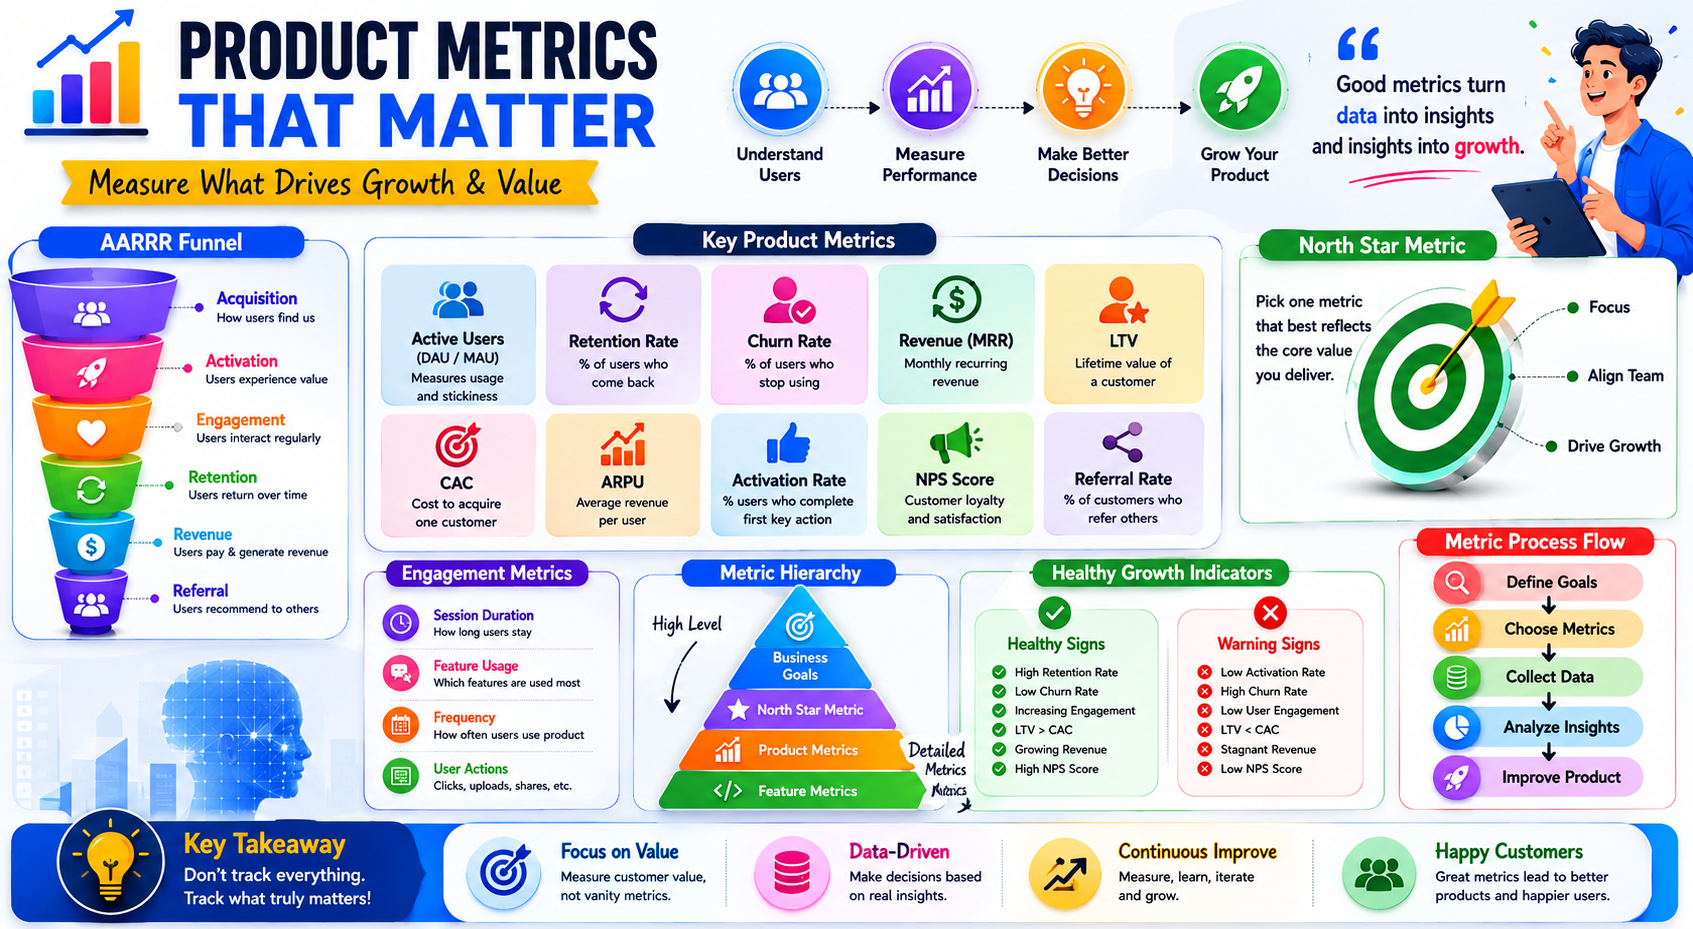
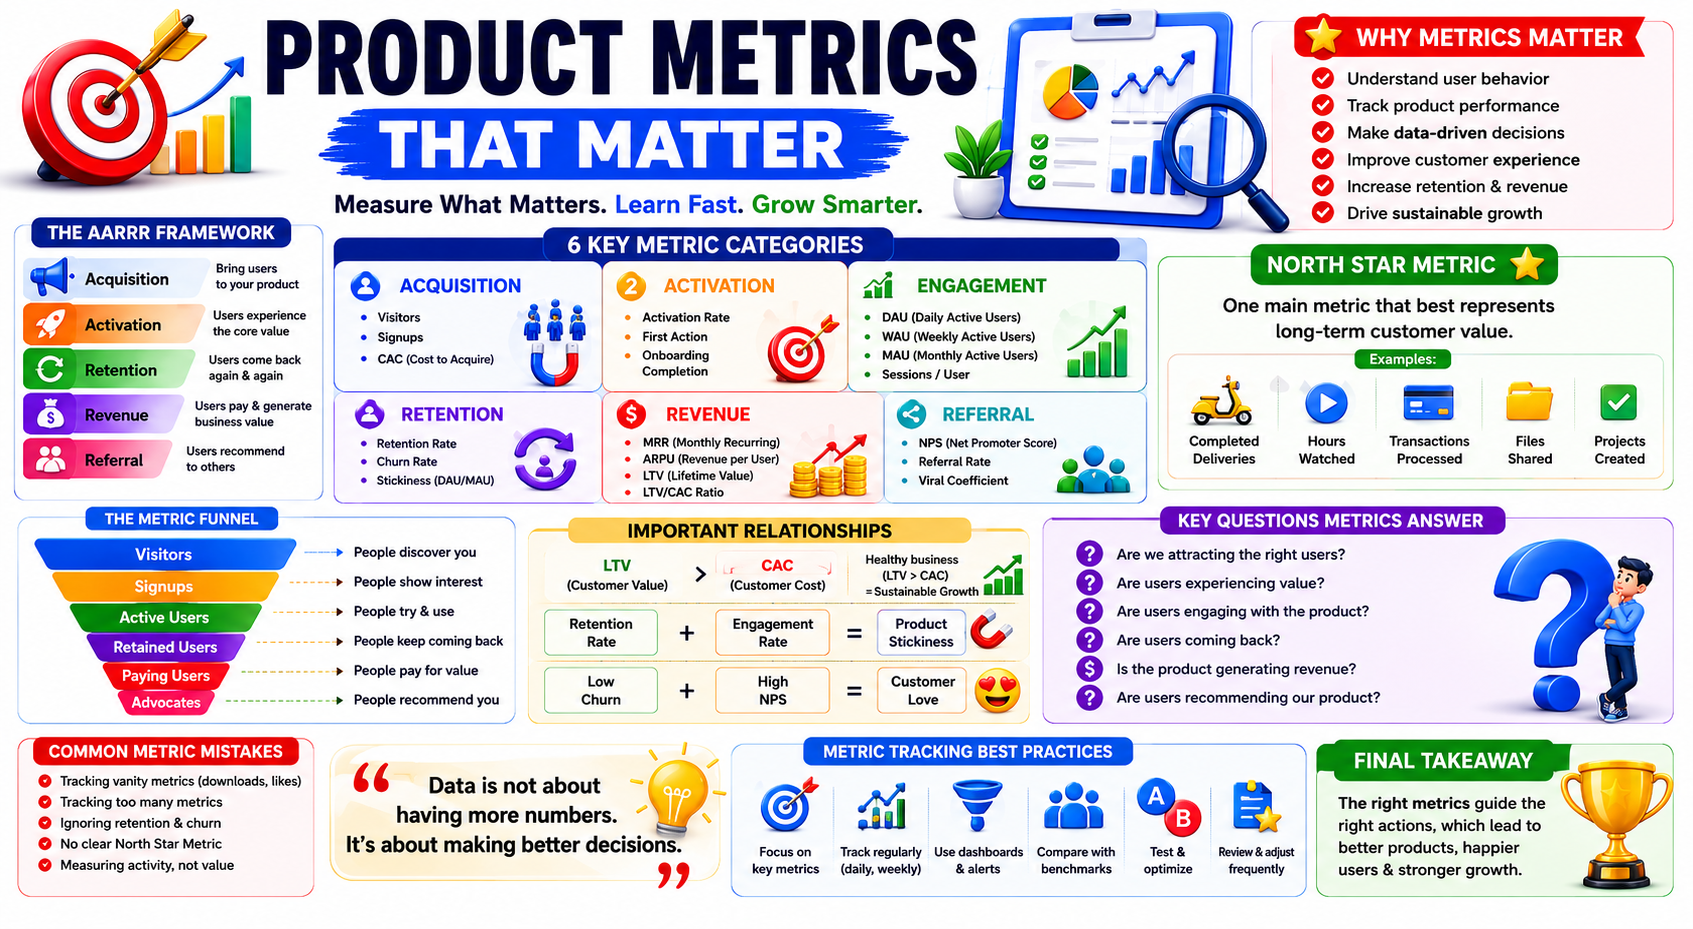
ACQUISITION
      ↓
ACTIVATION
      ↓
ENGAGEMENT
      ↓
RETENTION
      ↓
REVENUE
      ↓
REFERRAL
Not all metrics are important.
Bad Metrics
Total Downloads

Page Views

Social Likes
These can look impressive.
Good Metrics
Active Users

Retention

Revenue

Customer Satisfaction
These show real value.
Visitors
    ↓
Signups
    ↓
Active Users
    ↓
Returning Users
    ↓
Paying Customers
    ↓
Advocates
Acquisition answers:
How Are Users Finding Us?
People Visiting Product
People Registering
Cost to acquire one customer.
Flow
Marketing Spend
        ↓
New Customers
        ↓
CAC
Example
₹1,00,000 Marketing Spend

100 Customers Acquired
CAC:
₹1,000 Per Customer
Traffic
   ↓
Visitors
   ↓
Signups
Activation measures:
Did Users Experience Value?
Example
User signs up.
But does the user:
Create Profile?

Upload First File?

Complete First Task?
Activation Flow
Signup
   ↓
First Success Experience
   ↓
Activated User
For an expense tracker:
Signup
   ↓
Add First Expense
   ↓
Activation
Many users register.
Few experience value.
Engagement measures:
How Actively Users Use Product
Key Questions
How Often?

How Long?

How Deep?
Users Active Today
Users Active This Week
Users Active This Month
User
  ↓
Uses Product
  ↓
Returns Frequently
Measures stickiness.
Formula:
DAU ÷ MAU
Higher value means:
More Frequent Usage
DAU = 3,000

MAU = 10,000
Stickiness:
\frac{3000}{10000}=0.3
30%
Retention answers:
Do Users Come Back?
Many products fail here.
Bad
1000 Users Sign Up
       ↓
100 Stay
Good
1000 Users Sign Up
       ↓
800 Stay
Retention Flow
User
 ↓
Returns
 ↓
Retention
Measures:
Users Remaining
after a period.
Higher retention usually indicates:
Strong Product-Market Fit
Opposite of retention.
Measures:
Users Leaving
Flow
Customers
     ↓
Leave Product
     ↓
Churn
Goal:
High Retention

Low Churn
Revenue metrics answer:
Is Product Creating Business Value?
Measures:
Monthly Predictable Revenue
Flow
Customers
      ↓
Subscriptions
      ↓
MRR
Measures:
Yearly Recurring Revenue
Formula:
ARR = MRR × 12
Measures:
Revenue Generated
Per Customer
Flow
Revenue
   ↓
Customers
   ↓
ARPU
Measures:
Total Revenue
Generated By Customer
during their relationship.
Customer
      ↓
Purchases
      ↓
Lifetime Revenue
One of the most important business metrics.
Visualization
Customer Value
       ↓
LTV

Customer Cost
       ↓
CAC
Healthy Business
LTV > CAC
Unhealthy Business
LTV < CAC
Measures:
Do Users Recommend Product?
Referral Flow
Happy Customer
        ↓
Recommendation
        ↓
New Customer
Popular customer satisfaction metric.
Question:
How Likely Are You
To Recommend This Product?
Scores indicate:
Customer Loyalty
Measures:
Customers Acquired
Through Referrals
Higher referral rate often means:
Strong Customer Love
Also known as:
Pirate Metrics
Framework
Acquisition
      ↓
Activation
      ↓
Retention
      ↓
Revenue
      ↓
Referral
Visualization
AARRR Funnel

Visitors
    ↓
Users
    ↓
Active Users
    ↓
Paying Users
    ↓
Advocates
Many companies choose one primary metric.
Called:
North Star Metric
Examples
Completed Deliveries

Hours Watched

Files Shared

Projects Created
North Star Flow
Customer Value
       ↓
North Star Metric
       ↓
Business Growth
Ask:
Does This Measure Customer Value?

Does This Measure Growth?

Does This Support Business Goals?
BUSINESS GOALS
        ↓
NORTH STAR METRIC
        ↓
PRODUCT METRICS
        ↓
FEATURE METRICS
Acquisition
    ↓
Visitors
Signups

Activation
    ↓
First Action

Engagement
    ↓
DAU
MAU

Retention
    ↓
Retention Rate
Churn

Revenue
    ↓
MRR
LTV

Referral
    ↓
NPS
Referral Rate
Tracking Everything
100 Metrics
      ↓
No Focus
Tracking Vanity Metrics
Example
Downloads
without:
Usage
Ignoring Retention
Many teams focus only on acquisition.
Reality:
Retention Drives Growth
No North Star Metric
Results in:
Confusion
Measuring Activity Instead Of Value
Bad:
Number Of Clicks
Better:
Customer Success
□ Acquisition Metrics Tracked

□ Activation Metrics Tracked

□ Engagement Metrics Tracked

□ Retention Metrics Tracked

□ Revenue Metrics Tracked

□ Referral Metrics Tracked

□ North Star Metric Defined

□ Dashboard Updated Regularly
Users Arrive
      ↓
Acquire Users
      ↓
Activate Users
      ↓
Increase Engagement
      ↓
Improve Retention
      ↓
Generate Revenue
      ↓
Encourage Referrals
      ↓
Scale Growth
STEP 1
Define Business Goals
           ↓
STEP 2
Choose North Star Metric
           ↓
STEP 3
Track Acquisition
           ↓
STEP 4
Track Activation
           ↓
STEP 5
Track Engagement
           ↓
STEP 6
Track Retention
           ↓
STEP 7
Track Revenue
           ↓
STEP 8
Track Referrals
           ↓
STEP 9
Analyze Results
           ↓
STEP 10
Improve Product
| Metric | What It Measures |
|---|---|
| Signups | User Acquisition |
| CAC | Cost to Acquire Customer |
| Activation Rate | First Value Experience |
| DAU | Daily Usage |
| MAU | Monthly Usage |
| Retention Rate | Returning Users |
| Churn Rate | Users Leaving |
| MRR | Monthly Revenue |
| LTV | Customer Value |
| NPS | Customer Satisfaction |
Product metrics are not about:
Collecting Data
They are about:
Making Better Decisions
The essence of Product Metrics is:
ACQUIRE
    ↓
ACTIVATE
    ↓
ENGAGE
    ↓
RETAIN
    ↓
MONETIZE
    ↓
REFER
The best product teams don't succeed because they have the most data.
They succeed because they measure the right metrics, understand customer behavior, and use insights to continuously improve the product and business. 🚀
 Continue With Google
  Business