Cap Table stands for:
Capitalization Table
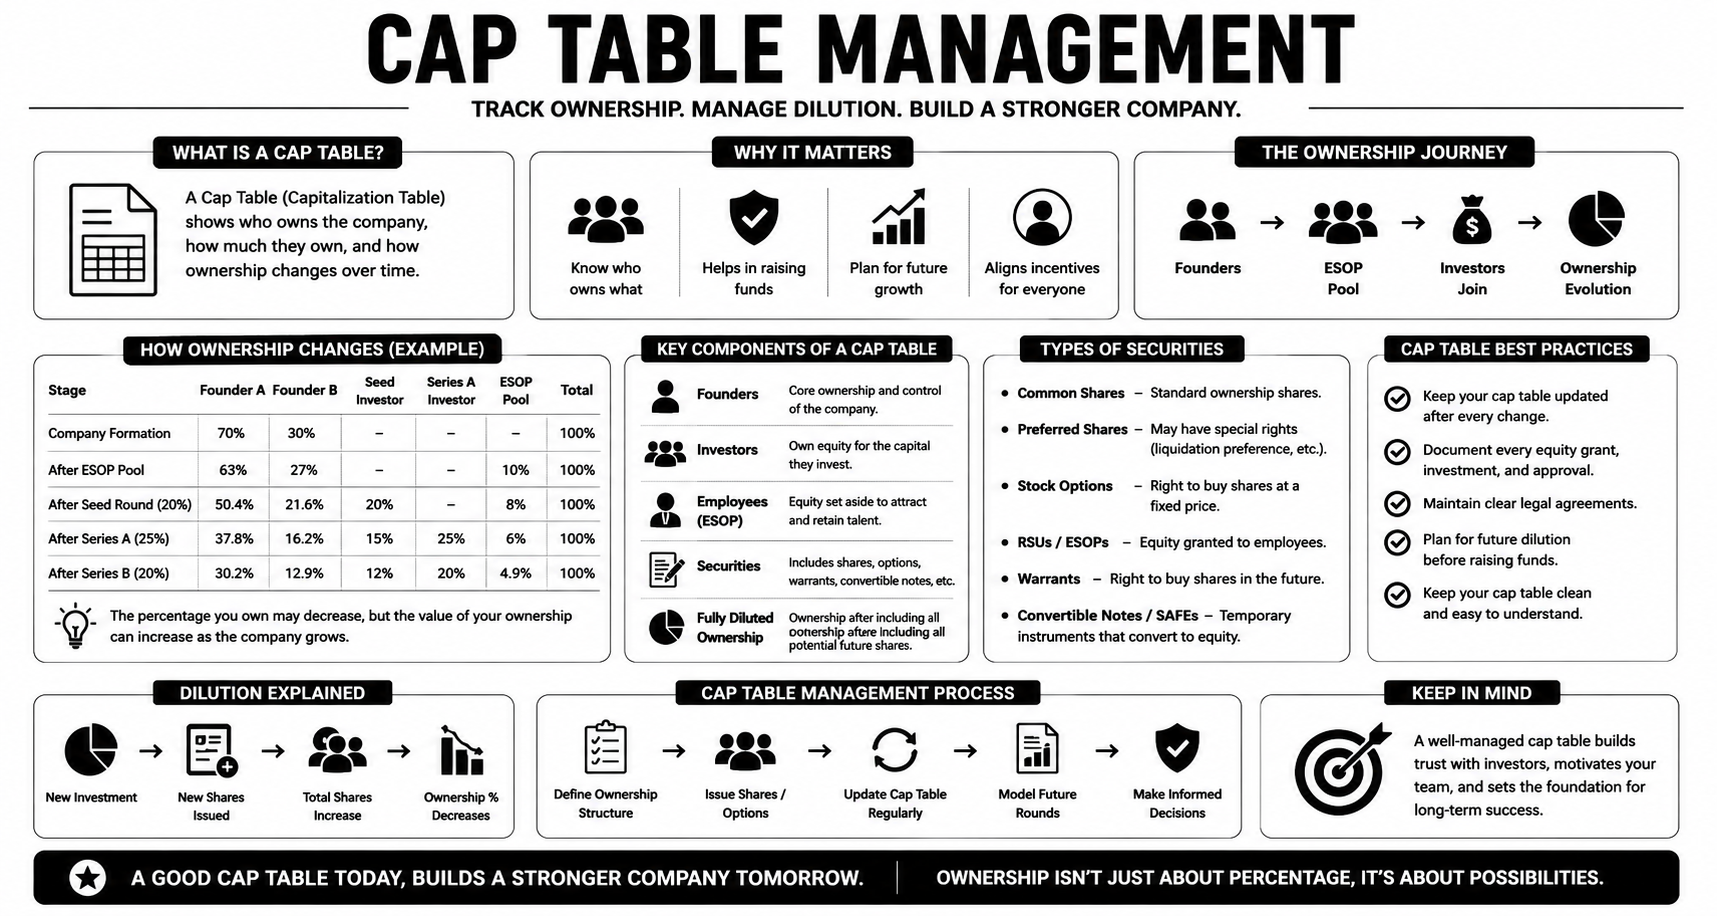
It is a document that shows:
Who Owns The Company
How Much They Own
How Ownership Changes
Think of it as:
The ownership scoreboard of a startup.
Imagine a pizza with 100 slices.
The pizza represents:
Entire Company
Ownership:
Founder A = 60 Slices

Founder B = 40 Slices
Visualization
100 Pizza Slices
       ↓
100% Company Ownership
Every slice represents ownership.
Investors care about:
Who Owns What?
Who Controls Decisions?
How Much Equity Is Available?
Without a Cap Table:
Ownership Confusion
With a Cap Table:
Clear Ownership Structure
Track:
Founders
Employees
Investors
Stock Options
Future Dilution
Company Ownership
        ↓
Founders
Investors
Employees
Option Pool
Imagine a startup has:
1,000,000 Shares
Ownership:
| Owner | Shares | Ownership |
|---|---|---|
| Founder A | 600,000 | 60% |
| Founder B | 400,000 | 40% |
| Total | 1,000,000 | 100% |
Visualization
Founder A = 60%

Founder B = 40%
A company is divided into shares.
Example
Company
   ↓
1,000,000 Shares
Ownership depends on:
Shares Owned
        ÷
Total Shares
Example
100,000 Shares
out of
1,000,000 Shares
equals
10% Ownership
Shares Owned
       ÷
Total Shares
       ↓
Ownership %
At company formation:
Ownership belongs to founders.
Example
Founder A = 70%

Founder B = 30%
Cap Table:
Founders
      ↓
100% Ownership
Based on:
Idea
Time Commitment
Experience
Capital Contribution
Responsibilities
Startups often reserve equity for employees.
Purpose:
Attract Talent
Reward Employees
Example
Before:
Founders = 100%
Create Option Pool:
Founders = 90%

ESOP Pool = 10%
Visualization
Founders
    ↓
Allocate ESOP
    ↓
Future Hiring
Employees become:
Owners
not just workers.
Now investors enter.
Example
Startup raises:
₹2 Crore
Investor receives:
20%
ownership.
Cap Table Changes.
Before Funding
| Owner | Ownership |
|---|---|
| Founders | 100% |
After Funding
| Owner | Ownership |
|---|---|
| Founders | 80% |
| Investor | 20% |
Dilution occurs when new shares are issued.
Flow
New Investment
        ↓
New Shares Issued
        ↓
Ownership Changes
Before
Founder = 100%
After Investor Joins
Founder = 80%

Investor = 20%
Founder owns less percentage.
This is:
Dilution
Dilution is not always bad.
Example
Before:
100% of ₹1 Crore
After Funding:
80% of ₹50 Crore
Ownership percentage decreased.
Value increased.
Less Percentage
       ↓
Larger Company
       ↓
Greater Wealth
Founder = 100%
Investor gets:
20%
Cap Table
Founder = 80%

Seed Investor = 20%
New investor gets:
25%
Cap Table becomes:
Founder = 60%

Seed Investor = 15%

Series A Investor = 25%
New investor joins.
Cap Table
Founder = 50%

Seed Investor = 12%

Series A = 20%

Series B = 18%
Founder
100%
 ↓
80%
 ↓
60%
 ↓
50%
₹1 Crore
 ↓
₹10 Crore
 ↓
₹100 Crore
 ↓
₹500 Crore
Cap table management means:
Track Ownership
      ↓
Track Shares
      ↓
Track Dilution
      ↓
Plan Fundraising
Issue Shares
       ↓
Update Ownership
       ↓
Track Investors
       ↓
Track Employees
       ↓
Model Future Rounds
Investors often ask for:
Fully Diluted Ownership
Includes:
Existing Shares
Stock Options
Warrants
Convertible Securities
Flow
Current Ownership
        +
Future Shares
        ↓
Fully Diluted Ownership
They want to know:
What ownership
will look like later?
Sometimes investors don't receive shares immediately.
Instead:
Convertible Note

or

SAFE
These convert later.
Flow
Investment
      ↓
Future Conversion
      ↓
Shares
A complete cap table tracks:
Ownership
Voting Rights
Investment Amount
Ownership
ESOP Grants
Future Hiring Equity
| Stakeholder | Ownership |
|---|---|
| Founder A | 45% |
| Founder B | 20% |
| Seed Investor | 15% |
| Series A Investor | 10% |
| ESOP Pool | 10% |
Investors evaluate:
Founder Ownership
ESOP Size
Future Fundraising Capacity
Questions:
Do founders still own enough?

Will future hiring require more equity?

Can future rounds happen?
Healthy cap table:
Founders Motivated
Employees Incentivized
Investors Protected
Unhealthy cap table:
Too Many Small Owners
Low Founder Ownership
Complex Structure
Giving Away Too Much Equity Early
Example
Founder Owns 100%
      ↓
Gives Away 60%
Too Early
Problem later.
No ESOP Pool
Makes hiring harder.
Ignoring Future Dilution
Today:
20% Dilution
Later:
Another 20%
Another 20%
Ownership shrinks significantly.
Poor Documentation
Creates legal issues.
Messy Share Structures
Investors dislike complexity.
Company Formation
         ↓
Founder Shares
         ↓
Create ESOP Pool
         ↓
Seed Funding
         ↓
Series A
         ↓
Series B
         ↓
Series C
         ↓
IPO / Acquisition
□ Track All Shareholders

□ Record Every Share Issue

□ Monitor Dilution

□ Maintain ESOP Records

□ Update After Funding Rounds

□ Model Future Ownership

□ Keep Legal Documents Updated
Issue Shares
      ↓
Raise Capital
      ↓
Grow Company
      ↓
Increase Valuation
      ↓
Raise More Capital
      ↓
Update Cap Table
      ↓
Repeat
STEP 1
Create Founder Ownership
          ↓
STEP 2
Issue Shares
          ↓
STEP 3
Create ESOP Pool
          ↓
STEP 4
Track Investments
          ↓
STEP 5
Monitor Dilution
          ↓
STEP 6
Update Ownership Records
          ↓
STEP 7
Plan Future Fundraising
          ↓
STEP 8
Maintain Clean Cap Table
A Cap Table is not just a spreadsheet.
It is:
The Ownership Map
Of A Startup
The essence of Cap Table Management is:
Shares
   ↓
Ownership
   ↓
Dilution
   ↓
Fundraising
   ↓
Growth
A well-managed cap table helps founders understand who owns the company today, how ownership changes over time, and how future fundraising decisions will affect everyone involved.
The best founders treat their cap table like a financial GPS—it guides every major ownership and investment decision throughout the startup journey.
 Continue With Google
  Economics
 Business

