✅ 100 Questions with One-Word
Answers (MCQ Style — No Options)
SECTION 1: Basics of Statistics (Q1–15)
- Statistics
primarily deals with data.
- The
first step in any statistical investigation is collection.
- Organizing
data in rows and columns is called tabulation.
- Grouping
data into classes is called classification.
- A
table showing frequency of observations is a distribution.
- The
main limitation of statistics is that it deals with averages.
- Data
collected first-hand is called primary.
- Data
collected from published sources is secondary.
- Numerical
facts are called quantitative data.
- Non-numerical
data are called qualitative.
- The
field dealing with data summary is descriptive statistics.
- The
field dealing with inference is inferential statistics.
- The
arrangement of data by time is a series.
- Raw
facts are called data.
- Classification
based on attributes is qualitative.
SECTION 2: Sampling Techniques (Q16–30)
- Sampling
based on equal chance is random.
- Selecting
samples at fixed intervals is systematic.
- Dividing
population into strata gives stratified sampling.
- Population
divided into clusters uses cluster sampling.
- A part
of population studied is a sample.
- A
complete count is a census.
- Sampling
error decreases with larger size.
- A
sample drawn with replacement is unrestricted.
- The
curve followed by large samples is normal.
- CLT
stands for theorem.
- Parameter
belongs to population.
- Statistic
belongs to sample.
- Finite
population correction is a multiplier.
- Sampling
distribution of mean tends to normal.
- The
method ensuring no bias is randomisation.
SECTION 3: Measures of Central Tendency (Q31–45)
- The
most common average is mean.
- The
middle value is median.
- The
most frequent value is mode.
- The
product-based average is geometric.
- Reciprocal-based
average is harmonic.
- The
simplest measure of dispersion is range.
- Half
of IQR is quartile deviation.
- Square-root
of variance is SD.
- Variance
is square of SD.
- Mean
with weights is weighted mean.
- Combined
mean uses weighted formula.
- Dispersion
relative measure is CV.
- Lack
of symmetry is skewness.
- Flatness
of distribution is kurtosis.
- A
perfectly symmetrical distribution has zero skewness.
SECTION 4: Correlation & Regression (Q46–60)
- Graphical
tool for correlation is scatter.
- Relationship
between variables is correlation.
- Regression
estimates prediction.
- Karl
Pearson coefficient ranges between one (±1).
- Best-fit
line is regression line.
- Error
of prediction is residual.
- Square
of correlation is R².
- Slope
in regression is called beta.
- Regression
minimizing squared errors is OLS.
- Standard
error of estimate measures accuracy.
- Positive
correlation moves upward.
- Negative
correlation moves downward.
- Correlation
of independent variables is zero.
- Prediction
of Y from X uses regression.
- Multiple
regression uses several predictors.
SECTION 5: Time Series (Q61–75)
- Long-term
movement in time series is trend.
- Regular
periodic movement is seasonal.
- Wave-like
movement is cyclical.
- Unpredictable
variations are irregular.
- Prediction
using past data is forecasting.
- Trend
measured via straight line is linear.
- Data
arranged chronologically is time series.
- Ratio-to-trend
method finds seasonal index.
- Moving
average smoothens fluctuations.
- Graph
showing trend is line graph.
- Seasonal
index above 100 means above average.
- Seasonal
index below 100 means below average.
- Components
of time series include trend.
- When
trend is removed, residual is irregular.
- Trend
measured by least squares is LSM.
SECTION 6: Probability & Distributions (Q76–90)
- Probability
values lie between one (0–1).
- P(A|B)
denotes conditional probability.
- Variable
with numeric outcomes is random.
- Probability
distribution of discrete variable is PMF.
- Probability
distribution of continuous variable is PDF.
- Expected
value is mean.
- Spread
of distribution is variance.
- Binomial
distribution has two outcomes.
- Poisson
distribution describes rare events.
- Normal
curve is bell shaped.
- Credit
risk uses concept of default.
- Tail-risk
measure is VaR.
- Z-score
relates to normal distribution.
- Option
pricing uses Black-Scholes.
- Area
under normal curve is one.
SECTION 7: Estimation (Q91–95)
- A
single value estimate is point.
- Range
estimate is interval.
- Parameter
guessed from sample is estimator.
- Interval
estimate uses confidence.
- Large
sample estimate uses z value.
SECTION 8: Linear Programming & Simulation (Q96–100)
- LP
graphical method applies in two variables.
- Feasible
region is always convex.
- LP
optimum lies at corner point.
- Simplex
method is iterative.
- Simulation
imitates reality.
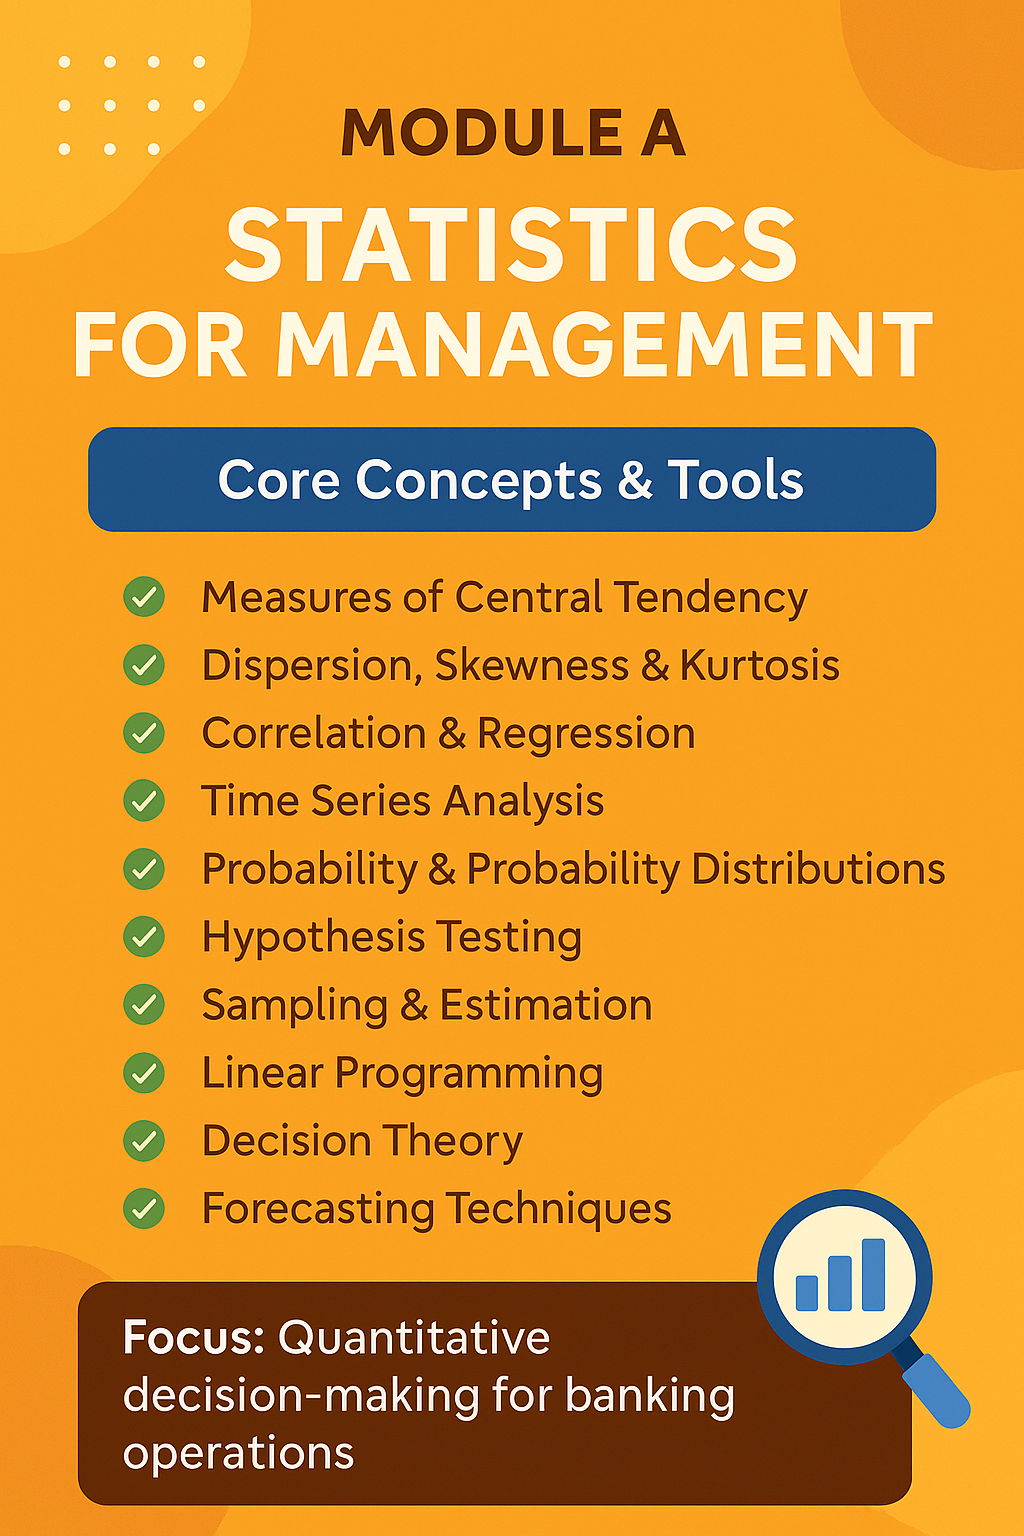
✅ CAIIB – Advanced Bank
Management – Module A (Statistics)
100 Topic-wise MCQs with Answers (No options)
📌 TOPIC 1 — BASICS OF
STATISTICS (Q1–15)
- The
science of collecting and analyzing data is called Statistics.
- Data
collected first-hand is known as Primary.
- Data
arranged in rows and columns is called Tabulation.
- Grouping
data on the basis of a characteristic is Classification.
- Numerical
data is known as Quantitative.
- A
table that displays frequency of items is Distribution.
- Information
collected from journals is Secondary.
- Data
arranged by time is Chronological.
- The
raw facts collected are called Data.
- A unit
on which observations are taken is a Variable.
- Arrangement
by size is called Array.
- No. of
observations constitutes Frequency.
- A list
of items under similar groups is Class.
- Highest
and lowest values difference is Range.
- A
graphic presentation of classes is a Histogram.
📌 TOPIC 2 — SAMPLING
TECHNIQUES (Q16–30)
- A
part of population used for study is a Sample.
- A
complete enumeration is a Census.
- Equal
chance of selection is Random.
- Dividing
population into strata is Stratified.
- Selecting
the kth element is Systematic.
- Random
groups selected as units are Cluster.
- Sampling
error reduces with larger Size.
- A
characteristic of population is a Parameter.
- A
characteristic of sample is a Statistic.
- The
theorem supporting normality in large samples is CLT.
- Sampling
distribution of mean tends to Normal.
- A
list of population units is Frame.
- Bias-free
selection is Randomisation.
- FPC
stands for Correction.
- Sample
mean is an Estimator.
📌 TOPIC 3 — CENTRAL
TENDENCY, DISPERSION, SKEWNESS (Q31–50)
- Sum
of values divided by count gives Mean.
- Middle-most
value is Median.
- Most
frequent value is Mode.
- The
product-based average is Geometric.
- Reciprocal
average is Harmonic.
- The
square root of variance is SD.
- Variation
relative to mean is CV.
- Half
of IQR is Quartile deviation.
- Measure
of flatness is Kurtosis.
- Lack
of symmetry is Skewness.
- Symmetrical
distribution has Zero skewness.
- Extreme
values affect Mean.
- Median
is best for Skewed data.
- Dispersion
measured by max-min is Range.
- Value
dividing data in 4 parts is Quartile.
- Mean
of means (pooled) is Combined mean.
- Squared
SD is Variance.
- Mean
unaffected by extreme value is Median.
- Positive
skew has a long Right tail.
- Negative
skew has a long Left tail.
📌 TOPIC 4 — CORRELATION
& REGRESSION (Q51–70)
- Graph
showing relationship is Scatter.
- Relationship
between two variables is Correlation.
- Prediction
model is Regression.
- Perfect
correlation equals One.
- Regression
minimizing errors is OLS.
- Difference
between predicted and actual is Residual.
- Regression
constant is Intercept.
- Regression
slope is Beta.
- Square
of correlation is R².
- A
correlation of zero means None.
- Predicting
Y from X uses Regression.
- Correlation
measured by Karl Pearson is Coefficient.
- Correlation
for rank data is Spearman.
- Regression
line represents Trend.
- Closeness
of fit is measured by R².
- Multiple
variables prediction uses Multiple regression.
- Regression
line is of type Linear.
- Positive
correlation moves Upward.
- Negative
correlation moves Downward.
- Standard
error of estimate indicates Accuracy.
📌 TOPIC 5 — TIME SERIES
(Q71–85)
- Long-term
movement is Trend.
- Short-term
periodic movement is Seasonal.
- Wave-like
movements are Cyclical.
- Unpredictable
variations are Irregular.
- Smoothing
is done by Moving average.
- Removing
seasonal influence gives Deseasonalised data.
- Time-related
data is Chronological.
- Ratio-to-trend
method finds Index.
- Forecasting
future is Projection.
- Seasonal
index above 100 means High.
- Seasonal
index below 100 means Low.
- Least
squares method fits Trend.
- Trend
line based on slope is Linear.
- Periodic
pattern is Seasonality.
- Trend
estimation uses LSM.
📌 TOPIC 6 — PROBABILITY
& DISTRIBUTIONS (Q86–100)
- Probability
ranges between Zero and One (answer: One).
- P(A|B)
indicates Conditional.
- A
variable with random outcomes is Random.
- Probability
mass function is PMF.
- Continuous
distribution function is PDF.
- Expected
value is Mean.
- Binomial
distribution has Two outcomes.
- Rare
event distribution is Poisson.
- Bell-shaped
curve is Normal.
- Area
under normal curve is One.
- Tail-event
risk is VaR.
- Credit
risk mostly depends on Default.
- Probability
of complement is Residual.
- Option
valuation uses Black-Scholes.
- CLT
leads sample mean to become Normal.
 Continue With Google
  Account and Finance